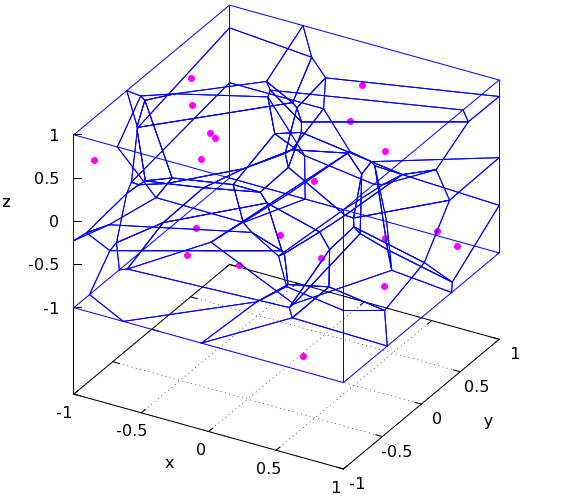
Voronoi diagrams are a well-established method in computational geometry, having seen applications across most all fields in the physical sciences. We introduce the notion here and proceed toward an uncommon direction: its connection to clustering algorithms in data.
Let be a non-empty set in a (Banach) space equipped with a specified norm , and a subspace of which contains but no other point . A Voronoi diagram is a partition of the space into cells , such that that a point lies in the cell corresponding to the element iff
The boundaries of each cell, or segments in a Voronoi diagram, correspond to all points in the space equidistant to the two nearest points. (More specifically, the segments are the collection of boundary points which minimize a sum of normed distances.)
This has a very natural physical intuition. Say you have a bunch of points on a map, and each point represents the location of a coffee shop; then the resulting Voronoi diagram displays the closest coffee shop for any point on the map. Use the norm in particular and you’ll have a measure of distance more accurately depicting the paths you can actually take in order to reach one coffee shop or another (hence why is also known as the taxicab distance).
Let’s alter the language in expressing Voronoi diagrams in a way slightly more fitting to computer science. The Voronoi diagram is a cut of the space into decision boundaries around each observation in a given set , such that any point in can be classified by the “most closely related” one in (by choice of minimizing the normed distance). Notice in particular that the Voronoi diagram is exactly the same as the resulting decision boundaries from the nearest neighbor algorithm (1-NN). In fact, it’s a natural idea to then use the algorithm involved in computing Voronoi diagrams as a way to reduce the number of expected distance calculations for -means [1].
This latter application is interesting because we are applying a parameter-free, extensible method to help initialize a randomized one. For example, it is inherent from the minimization problem in Voronoi diagrams that one can assign weights to each point, so that the Voronoi diagram assigns more/less space based on the weight multiplied by the distance to the point.
Here’s an example: not all coffee shops are equal, so say we’d be more willing to trek the distance for certain ones more than others; we may decide not to go to Starbucks unless it were very very close, or we just like Blue Bottle so much that we would disregard most of the time it would take to arrive there. To include this information into our model, we can assign a weight to each coffee shop by measure of tastiness (or whatever additional metric—possibly some nonlinear combination of an arbitrarily large number of parameters), and then use the newly reformed Voronoi diagram as one’s classification system.
Further, the weights to be assigned to each observation do not necessarily need to be known. From a Bayesian perspective, we can assign these weights based on a prior distribution which reflects our own knowledge of how “important” certain points may be than others. I’m unaware of anyone taking this weighted Voronoi approach (equipped with priors) to clustering. It could be a worthy approach giving rise to new challenges and solutions, and one certainly worth investigating in more detail. (A fleeting thought is that weighted Voronoi diagrams are an equivalent formulation of clustering the data set with parameters by minimizing the normed distance.)
